https://www.kaggle.com/learn/geospatial-analysis
Learn Geospatial Analysis Tutorials
Create interactive maps, and discover patterns in geospatial data.
www.kaggle.com
지리 공간 데이터 또는 지리적 위치가 있는 데이터를 랭글링하고 시각화하는 다양한 방법에 대해 배울 것.

글로벌 비영리 단체가 필리핀의 외딴 지역에서 활동 범위를 확장해야 하는 곳은 어디입니까?
멸종 위기에 처한 새 종인 보라색 마틴은 북미와 남미 사이를 어떻게 여행합니까? 새들이 보호 구역으로 이동하고 있습니까?
추가 지진 보강으로 잠재적으로 이익을 얻을 수 있는 일본의 지역은 어디입니까?
Reading data
첫 번째 단계는 지리 공간 데이터를 읽는 것입니다! 이를 위해 GeoPandas 라이브러리를 사용합니다.
import geopandas as gpdshapefile, GeoJSON, KML 및 GPKG와 같은 매우 다양한 지리 공간 파일 형식이 있습니다. 이 세부 과정에서는 이들의 차이점에 대해 논의하지 않겠지만 다음 사항을 언급하는 것이 중요합니다.
- shapefile은 접하게 될 가장 일반적인 파일 형식이며 이러한 모든 파일 형식은 gpd.read_file() 함수로 빠르게 로드할 수 있습니다.
다음 코드 셀은 뉴욕주 환경보존부에서 관리하는 숲, 황무지 및 기타 토지에 대한 정보가 포함된 shapefile을 로드합니다.
# Read in the data
full_data = gpd.read_file("../input/geospatial-learn-course-data/DEC_lands/DEC_lands/DEC_lands.shp")

# View the first five rows of the data
full_data.head()
"CLASS" 열에서 볼 수 있듯이 처음 5개 행은 각각 다른 FOREST에 해당합니다.
Prerequisites
데이터의 처음 5개 행을 보기 위해 head() 메서드를 사용했습니다. 이것이 Pandas DataFrame을 미리보기 위해 사용하는 것임을 기억할 것입니다. 실제로 DataFrame과 함께 사용할 수 있는 모든 명령은 데이터와 함께 작동합니다!
데이터가 (Pandas) DataFrame의 모든 기능이 있는 (GeoPandas) GeoDataFrame 개체에 로드되었기 때문입니다.
data = full_data.loc[:, ["CLASS", "COUNTY", "geometry"]].copy()우리는 value_counts() 메서드를 사용하여 데이터 세트에 나타나는 횟수와 함께 다양한 토지 유형 목록을 확인합니다.
# How many lands of each type are there?
data.CLASS.value_counts()
# Select lands that fall under the "WILD FOREST" or "WILDERNESS" category
wild_lands = data.loc[data.CLASS.isin(['WILD FOREST', 'WILDERNESS'])].copy()
wild_lands.head()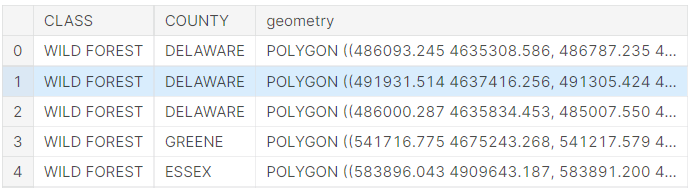
Create your first map!
wild_lands.plot()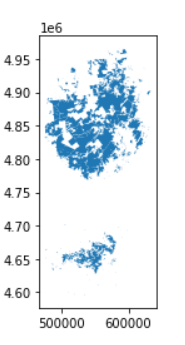
# View the first five entries in the "geometry" column
wild_lands.geometry.head()
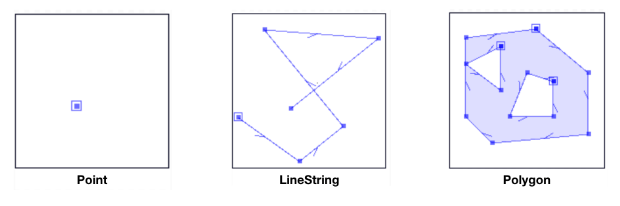
이 열에는 다양한 데이터 유형이 포함될 수 있지만 각 항목은 일반적으로 Point, LineString 또는 Polygon입니다.
데이터세트의 "Geometry" 열에는 2983개의 서로 다른 다각형 개체가 포함되어 있으며, 위 그림에서 각각 다른 모양에 해당합니다.
아래 코드 셀에서 캠프장 위치(Point), 도보 트레일(LineString) 및 카운티 경계(Polygon)를 포함하는 세 개의 GeoDataFrame을 더 생성합니다.
# Campsites in New York state (Point)
POI_data = gpd.read_file("../input/geospatial-learn-course-data/DEC_pointsinterest/DEC_pointsinterest/Decptsofinterest.shp")
campsites = POI_data.loc[POI_data.ASSET=='PRIMITIVE CAMPSITE'].copy()

# Foot trails in New York state (LineString)
roads_trails = gpd.read_file("../input/geospatial-learn-course-data/DEC_roadstrails/DEC_roadstrails/Decroadstrails.shp")
trails = roads_trails.loc[roads_trails.ASSET=='FOOT TRAIL'].copy()

# County boundaries in New York state (Polygon)
counties = gpd.read_file("../input/geospatial-learn-course-data/NY_county_boundaries/NY_county_boundaries/NY_county_boundaries.shp")
plot() 메서드는 모양을 customizing하는 데 사용할 수 있는 여러 매개 변수를 입력(선택 사항)으로 사용합니다. 가장 중요한 것은 ax 값을 설정하면 모든 정보가 동일한 지도에 표시된다는 것입니다.
# Define a base map with county boundaries
ax = counties.plot(figsize=(10,10), color='none', edgecolor='gainsboro', zorder=3)

# Add wild lands, campsites, and foot trails to the base map
wild_lands.plot(color='lightgreen', ax=ax)
campsites.plot(color='maroon', markersize=2, ax=ax)
trails.plot(color='black', markersize=1, ax=ax)
'AI > Geospatial Analysis' 카테고리의 다른 글
| Coordinate Reference Systems (0) | 2022.11.21 |
|---|